Technology advancements have made an immense amount of data available in today’s world, reaching levels that may seem unimaginable. This influence is particularly felt in the sports, entertainment, and tourism industries, where emphasizing enhancing guest experiences, streamlining operations, and building revenue is noteworthy and necessary. Accessing and analyzing large amounts of data empowers organizations in these sectors to make informed decisions and stay innovative.
While traditional data analytics methods – like CRM systems and other digital analytics tools – have been helpful, companies frequently encounter data inconsistencies. Misguided strategies and decisions based on incomplete or inaccurate information can lead to missed opportunities.
AI-powered chats are changing the game. They provide direct access to what matters to customers the most. Satisfi Lab’s AI Chat, powered by generative AI and Context NLP, plays a crucial role in not only how businesses interact with guests but also how they connect, understand, and improve.
Unlocking Insights with AI Chat’s Analytics Dashboard
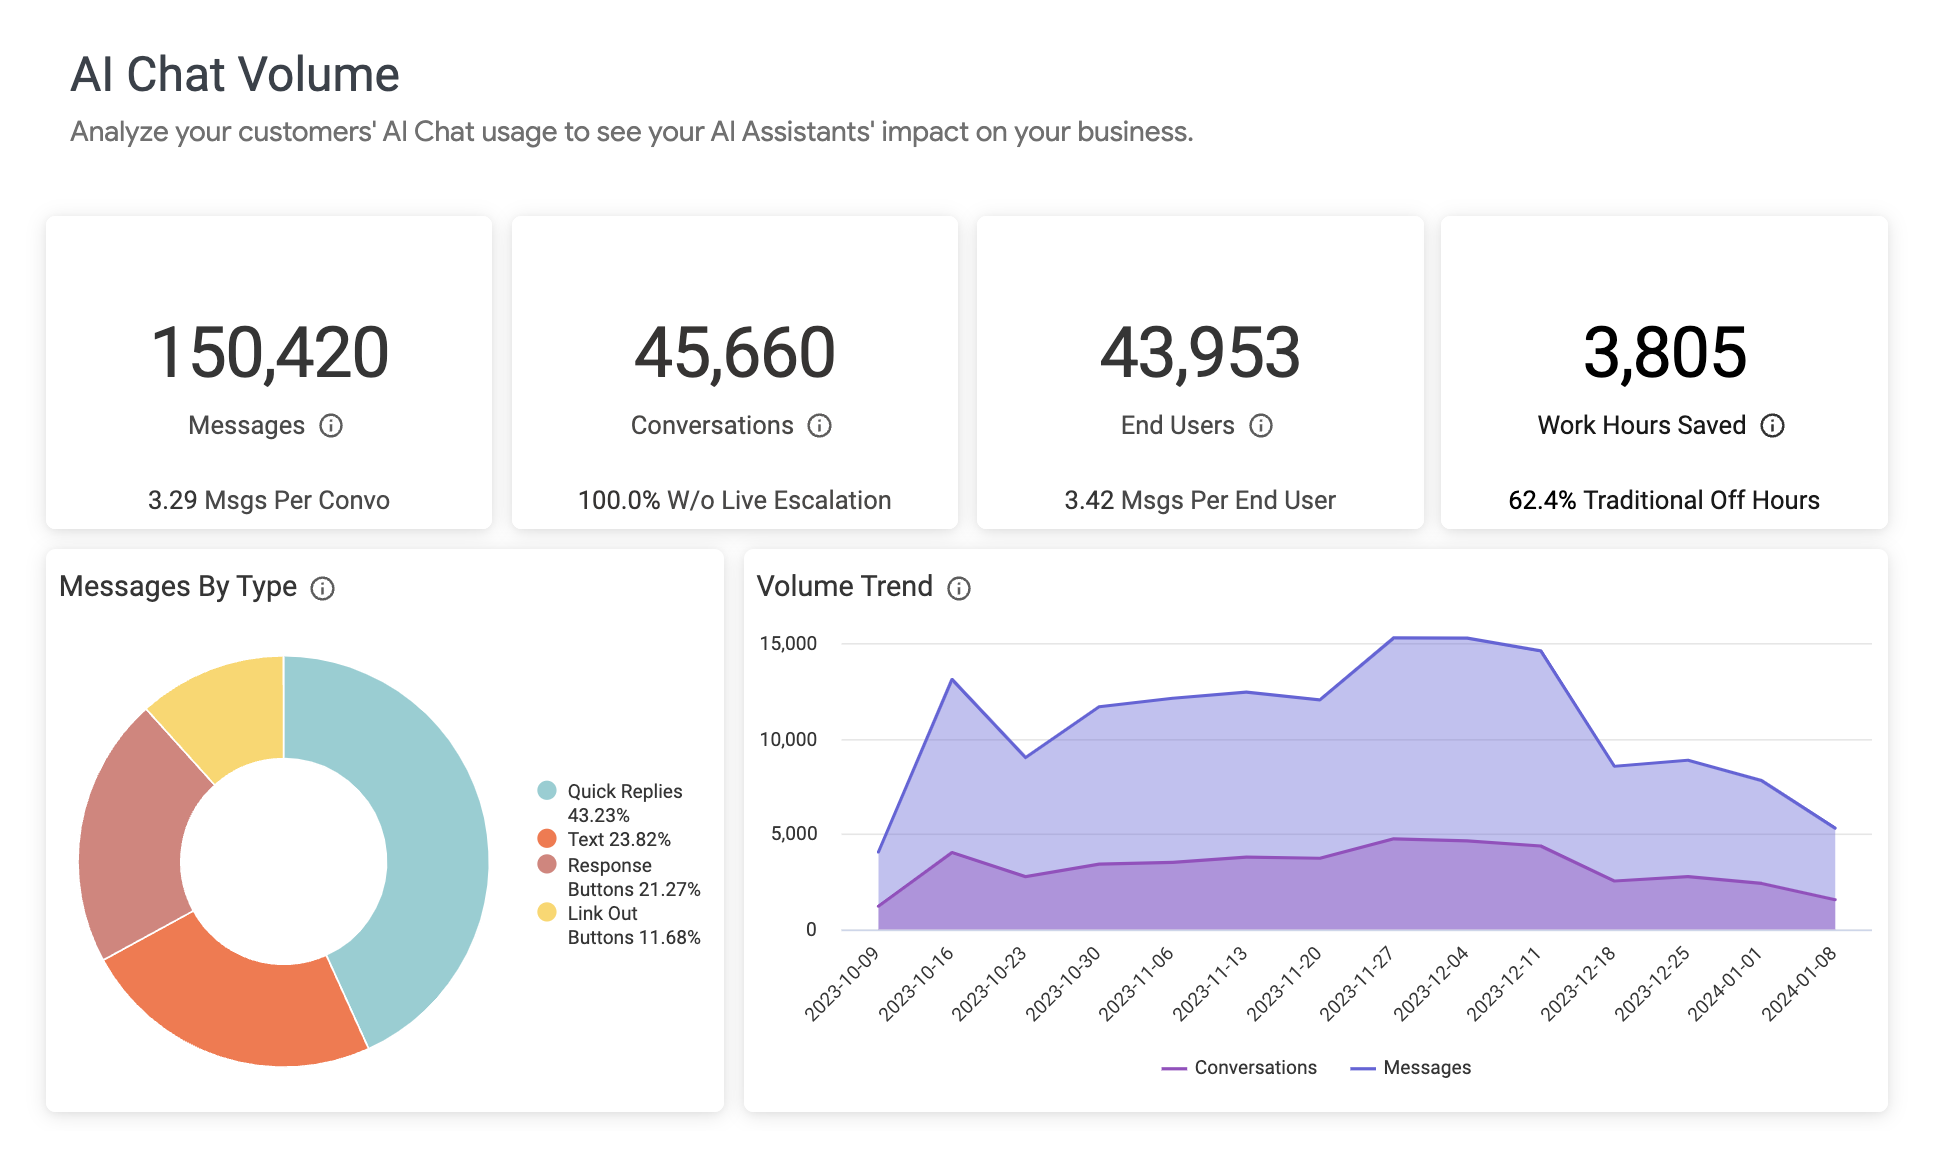
Satisfi’s analytics dashboard isn’t just a tool; it’s a treasure trove of insights that transforms raw data into actionable strategies. In our exploration, we’ll focus on three measurements that simplify the decision-making process for professionals in the sports, entertainment, and tourism industries.
Click-Through Rate (CTR) – The Pulse of User Engagement
Understanding CTR:
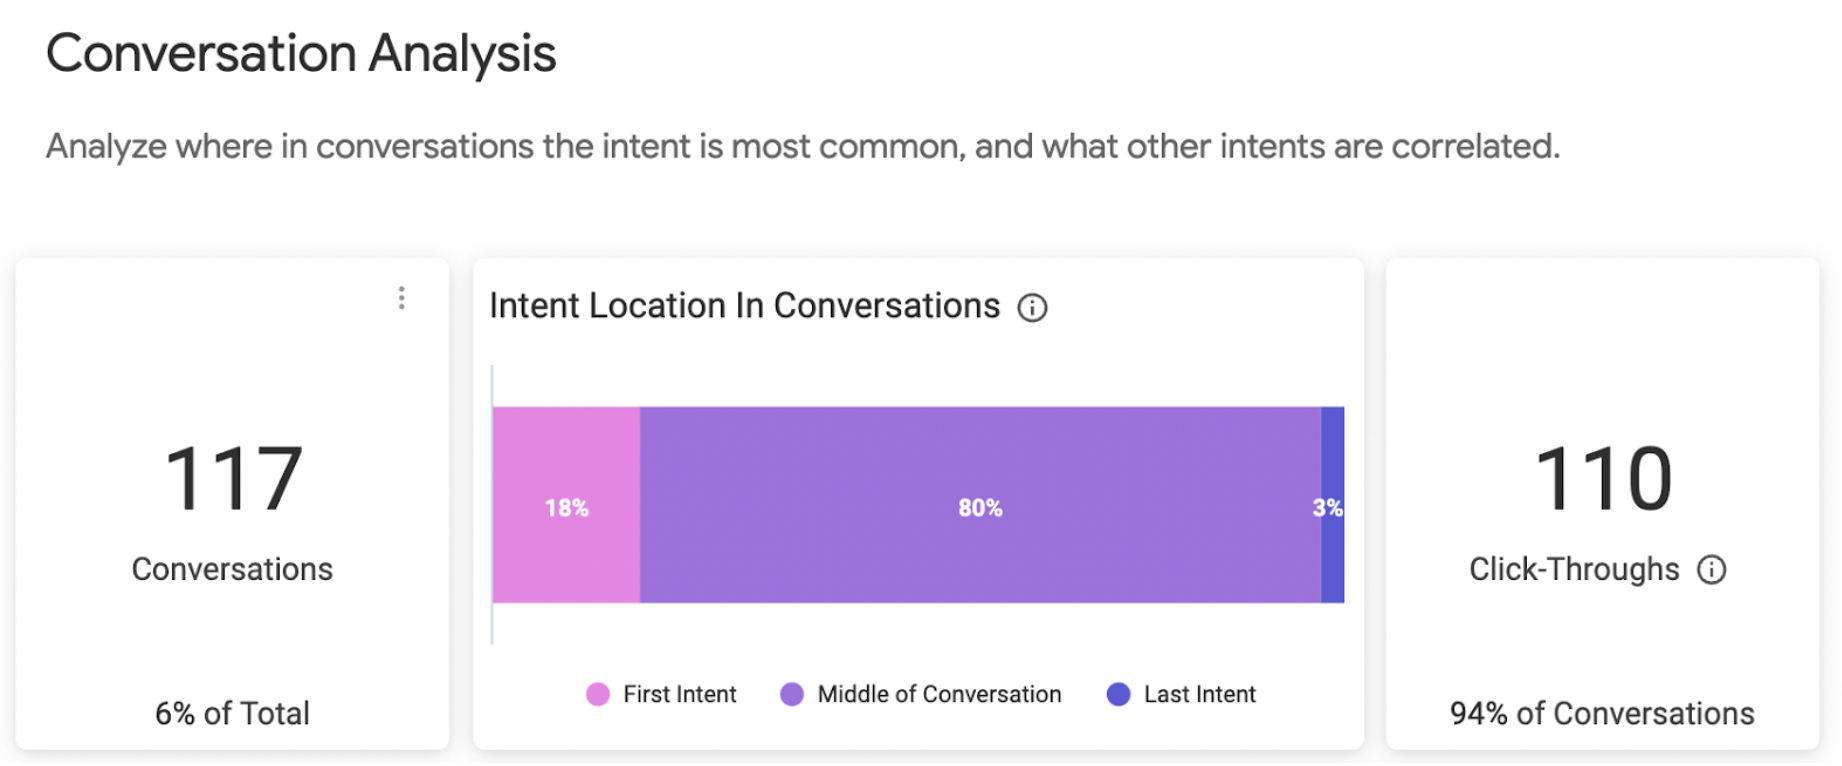
Click-through rate (CTR) measures the number of conversations where the user has clicked on buttons in a response, providing a tangible metric around how often your AI Chat is driving traffic to your most important web pages. In simpler terms, it’s a gauge of how well your audience interacts with the AI Chat’s content.
Businesses care immensely about CTR because it provides a deeper look into user engagement. A higher CTR signifies that users are actively interacting with specific content topics, showing interest, and potentially progressing toward desired actions. Combined with your strategy for button placement, this metric directly reflects AI Chat’s effectiveness in capturing and maintaining user attention.
Take Advantage of Improved CTR Using AI Chat
Here are a couple of examples of how you can improve CTR using AI Chat.
- Optimizing Ticket Sales
Ensuring a high CTR on the “Buy Tickets” button is crucial. Adjust messaging and increase placement, like placing a button on the welcome message to drive more clicks. Enrich all ticket-buying intents with the relevant buttons driving the ticket sales.
- Boosting Upsell Opportunities
Leverage CTR to identify opportunities for upselling. Tailor responses with strategically placed buttons that seamlessly lead users to upsell options—think merchandise, upgrades, or premium offerings. The data-backed insights from our Intent Deep-Dive Dashboard guide you in optimizing these opportunities, ensuring our upselling endeavors not only align with user interests but also significantly contribute to revenue maximization.
An entertainment venue used the Analytics Dashboard to track the CTR for buttons in their AI Chat responses. They discovered that a button directing users to their online merchandise store had a very low CTR. By changing the button’s text and placement, they were able to significantly increase the number of users clicking on the button and purchasing merchandise.
Intent Explorer
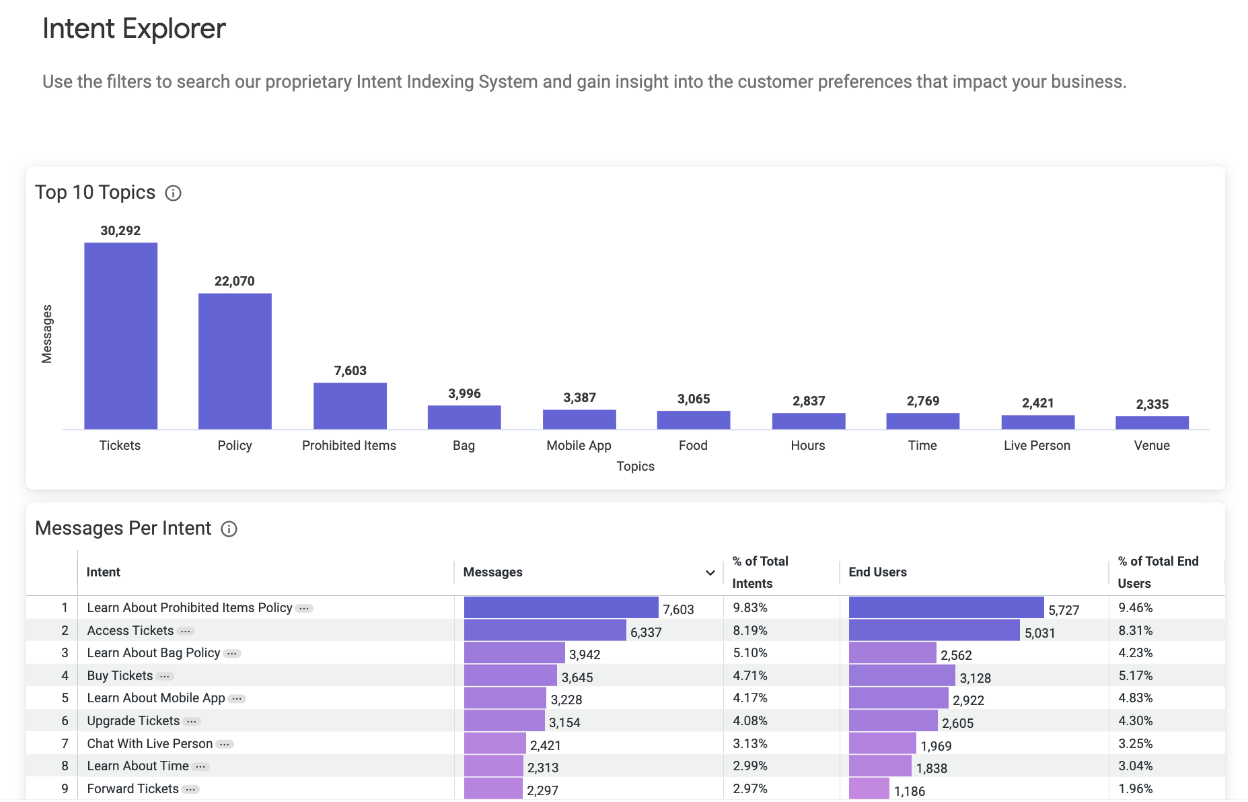
The Intent Explorer Dashboard is a powerful tool designed to provide accessible business-driving insights. With the help of intuitive filters, you can easily explore intents and gain unique insights into customer preferences that directly impact business decisions.
Using the dashboard, you can leverage filters to search for specific intents, categories, or actions within the indexed data. By clicking on a specific intent, you can deep-dive into detailed information related to it.
How to Use Intent Explorer to Evaluate Revenue Streams
- The Filter by Category option offers flexibility in exploring dimensions across various topics. For example, you can identify which beer brands or ticket types are most interesting to customers, or which policies they frequently ask about that may be causing confusion.
Tip #1
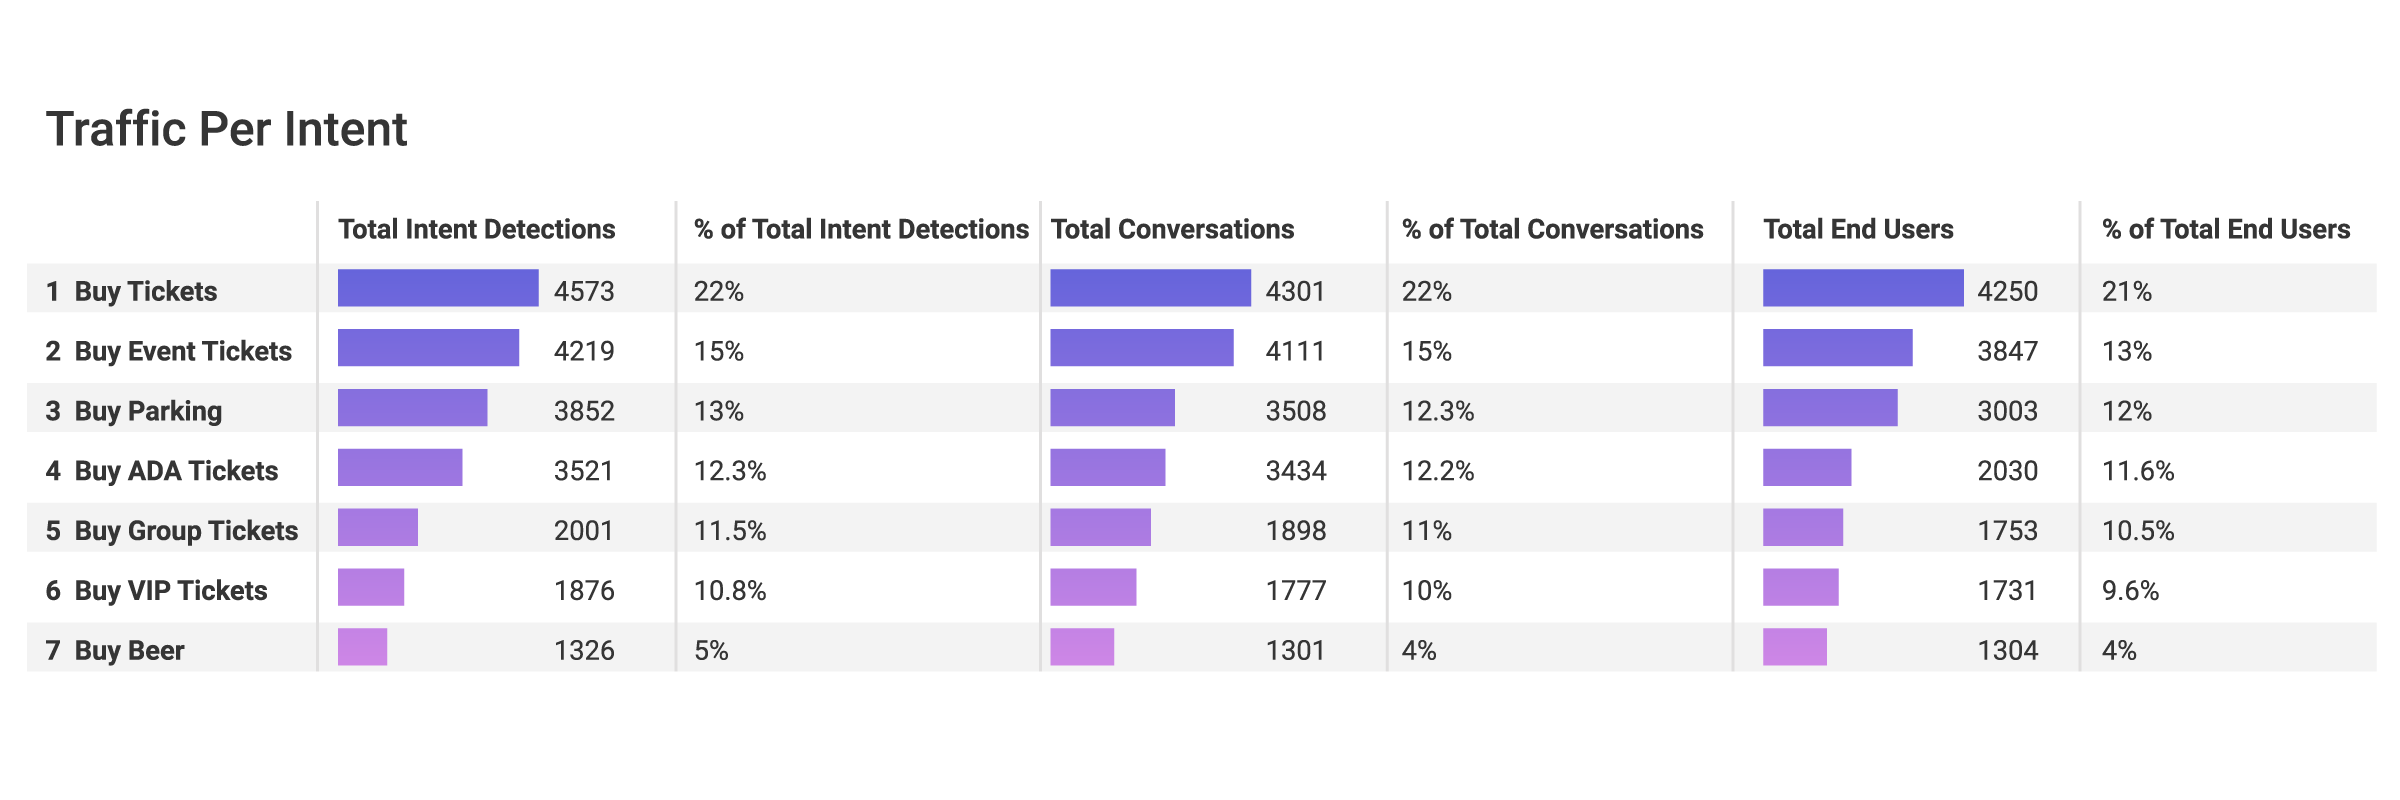
By choosing the Ticket Types category you can see which ticket types are in the most demand across your customers.
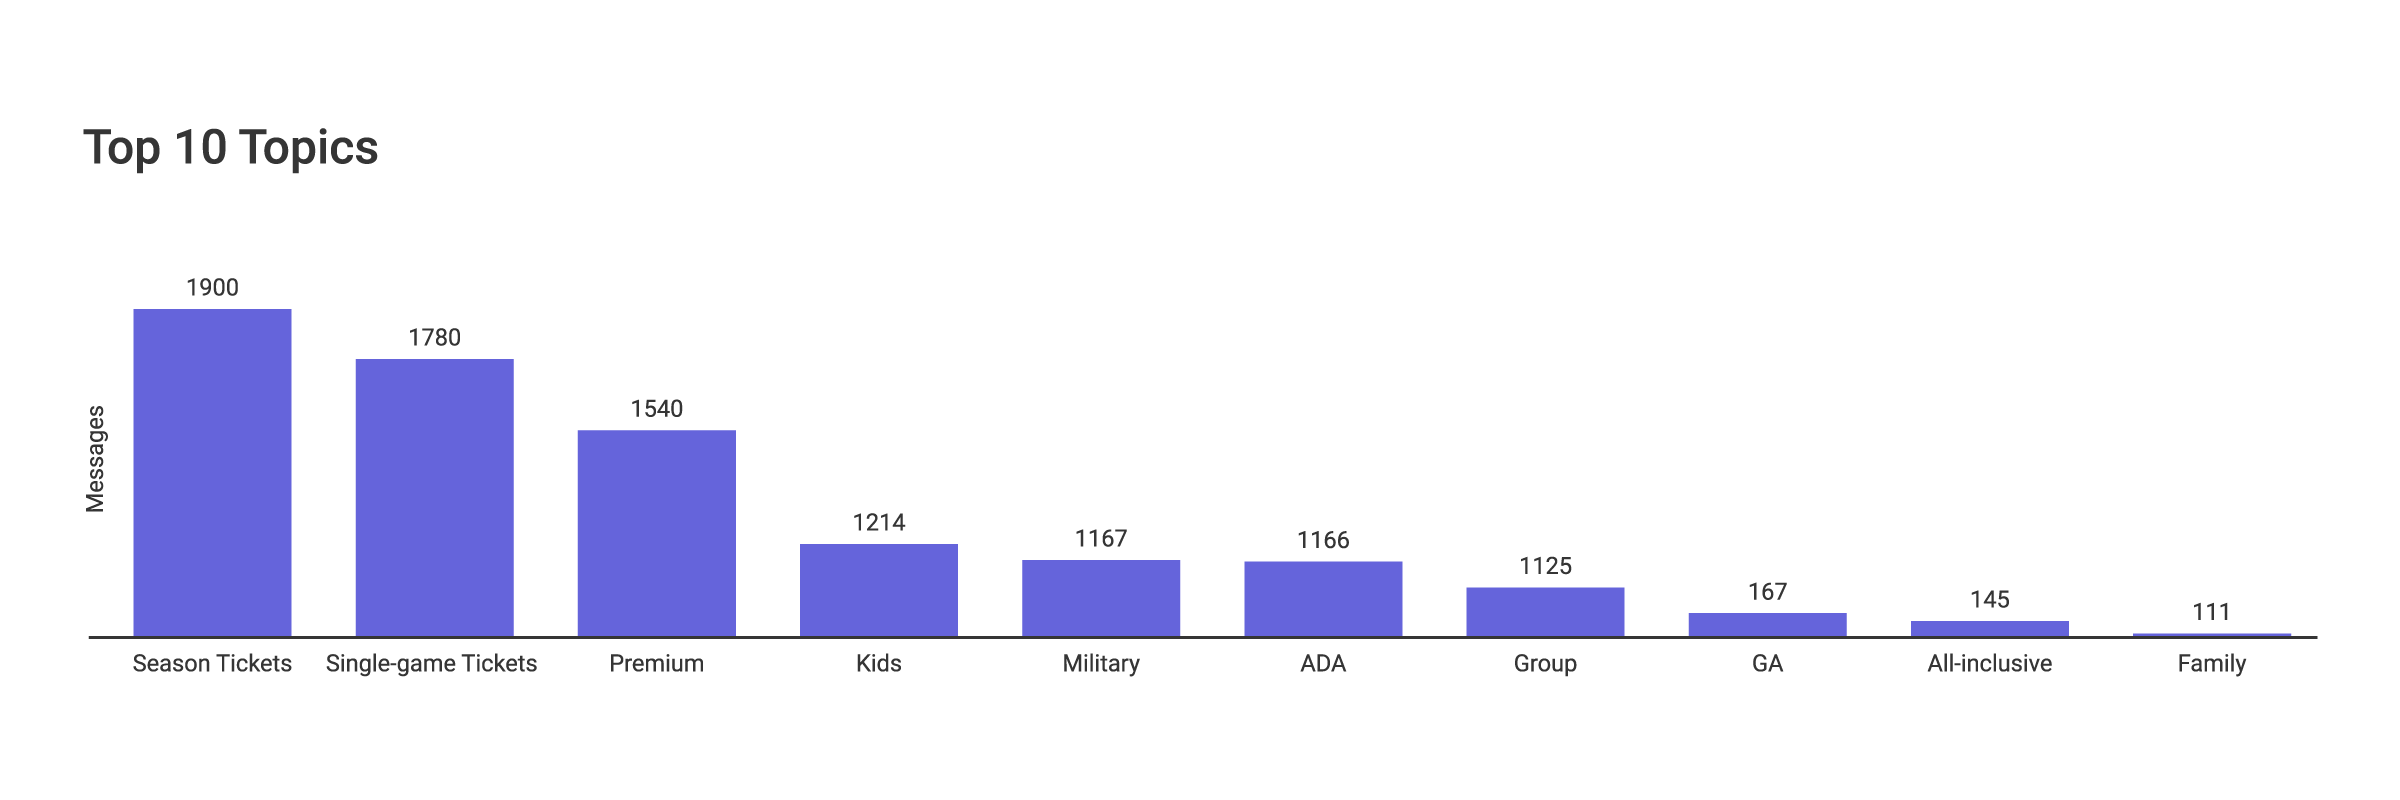
- The Filter by Action option allows you to refine your analysis based on specific actions. This enables you to focus on improving customer service by searching for complaint-related actions or identifying revenue-generating intents by filtering for buying actions.
Tip #2
By choosing the Buy action, you can see not only the most popular topics for this Action but also the percentage of total conversations that included this revenue-generating intent.
Top Intents – A Glimpse Into User Interests
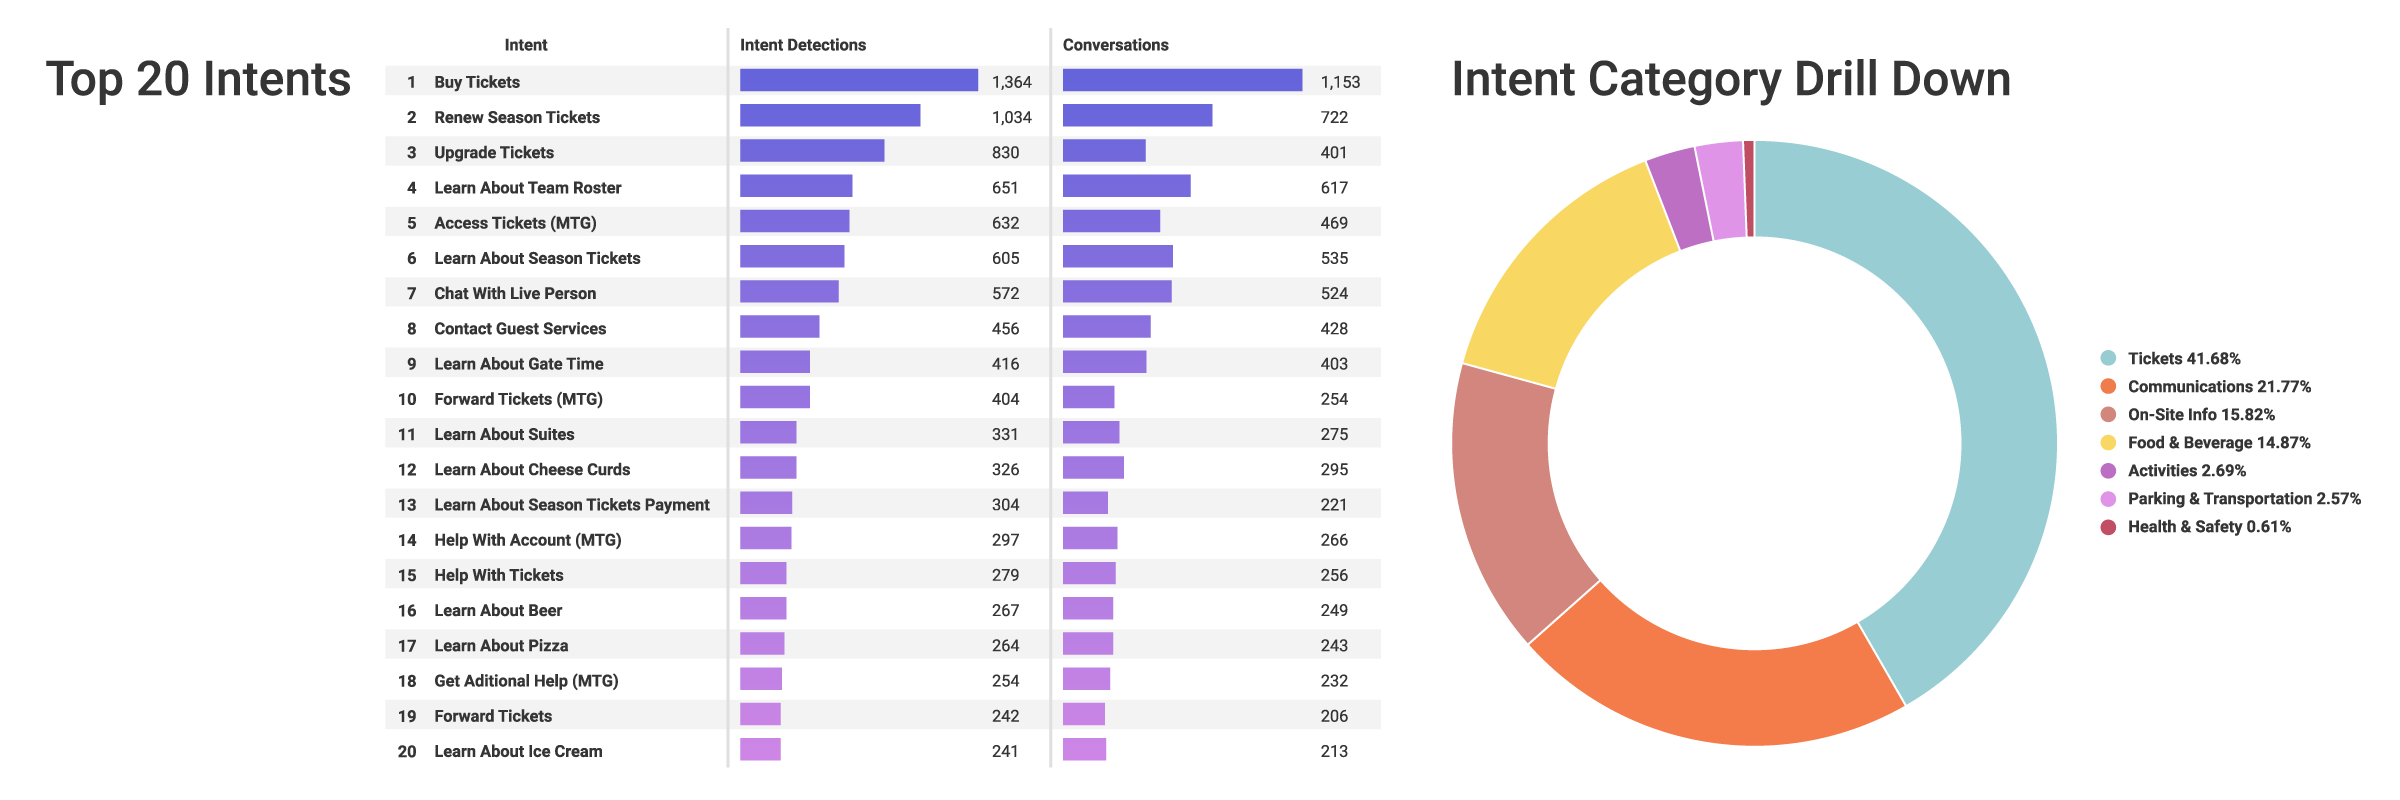
Top Intents is a snapshot of what captures visitors’ attention the most and drives inquiries, providing a roadmap for business strategy refinement.
Businesses hold the Top Intents report in high regard due to its capacity to unveil not just what users are looking for but also the intensity of their interest. This metric essentially becomes a compass, guiding content strategy refinement in a way that resonates most effectively with the audience.
How to Use the Top Intents Report to Improve Business Strategy
Here are a few examples showing how you can improve your strategy using this helpful report.
- Identify prevalent user queries related to ticketing. Whether event-specific details, seating arrangements, or special promotions, this insight allows you to tailor your content strategy to meet these ticketing needs head-on. Craft targeted content that addresses these top intents, ensuring users find comprehensive information effortlessly.
- Create more content that aligns with the top intents. If users consistently inquire about parking, tailor website content and adjust AI Chat’s knowledge volume to provide detailed information about parking facilities, rates, and related promotions.
- Identify top intents related to partnerships and sponsorships. Work with the Partnerships department to identify new opportunities. Tailor content and chat branding to promote these relationships using AI Chat’s advanced features. The result? A boost in revenue and an enhanced brand reputation that resonates with your audience.
Mississippi State University's Story
A recent success story involves Mississippi State’s softball ticket sales strategy. Analyzing their data over the years, they identified a significant fan interest in purchasing softball tickets. Mississippi State decided to launch ticket sales for softball—a noteworthy shift prompted by insights gleaned from our Analytics Dashboard.
Empowering Businesses with Data-Driven Insights
Our AI Chat’s Analytics Dashboard represents a paradigm shift in how businesses in the sports, entertainment, and tourism industries approach data. By transforming raw data into actionable strategies, companies are empowered to enhance their guest experiences, streamline their operations, and maximize revenue effectively.
The examples of improved CTR, optimized ticket sales, and targeted content strategies are just the beginning. As businesses continue to harness the power of AI and data analytics, the potential for innovation and growth is limitless! In an era where data is king, this Analytics Dashboard is your crown jewel, ensuring that every decision is data-driven, strategic, and aligned with your organizational goals.

